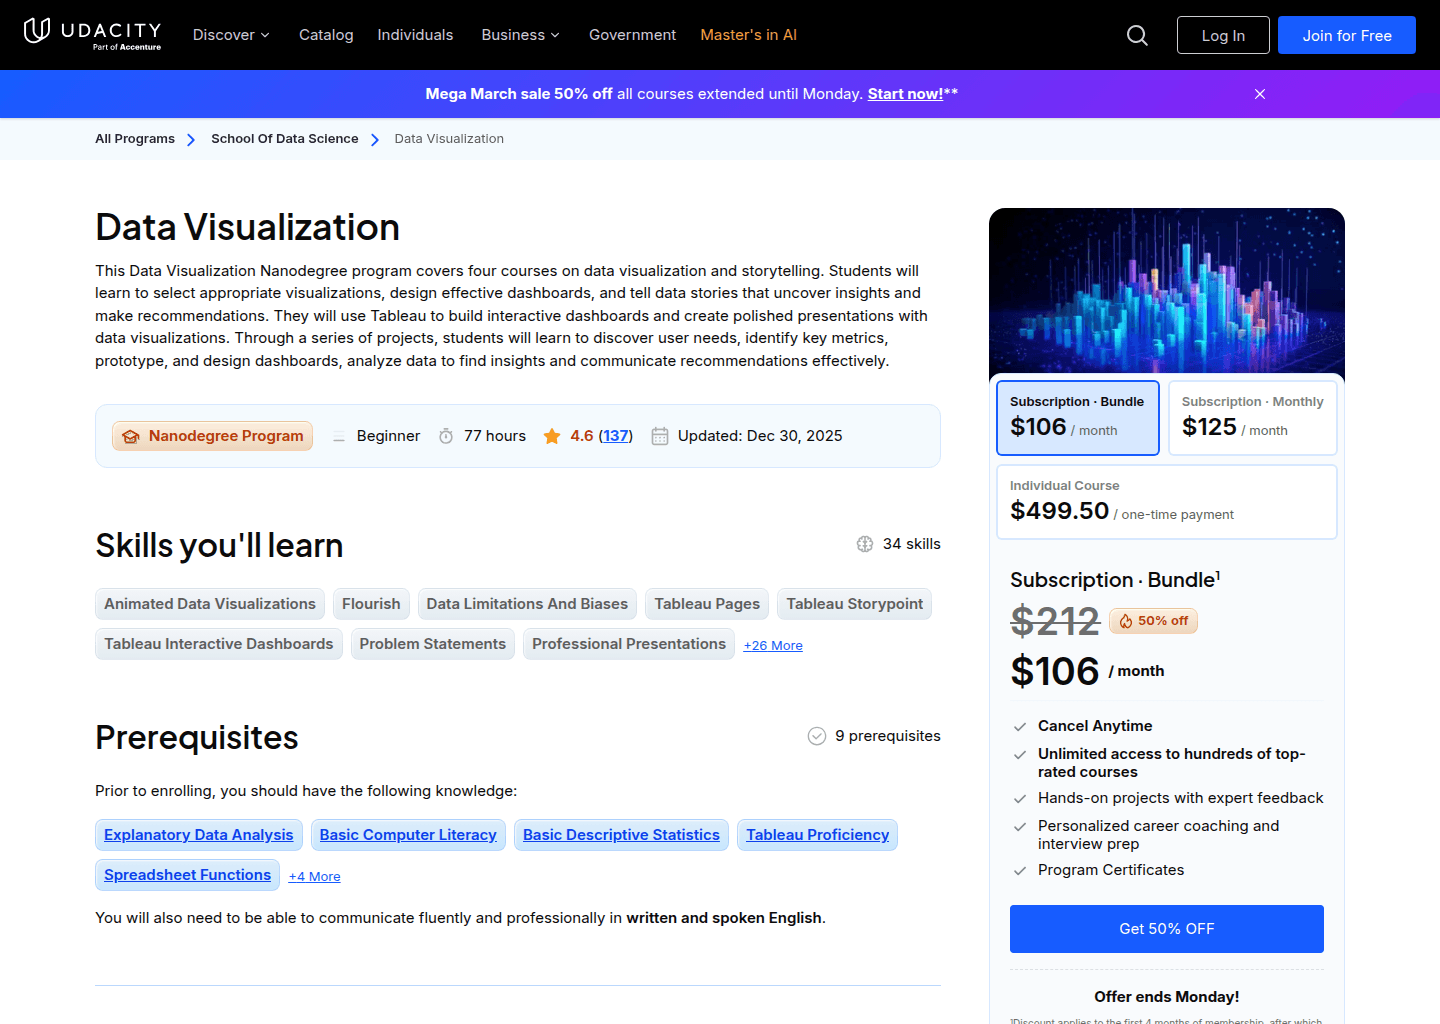
Data Visualization Nanodegree Program
Learn storytelling and dashboard design with Tableau
Overview
Visualization is only valuable if it sharpens decisions. This course looks at how product teams translate complex datasets into signals that guide prioritization, experimentation, and executive alignment. Instead of focusing purely on chart-building, it explores how to frame questions, choose metrics worth visualizing, and design dashboards that reveal behavior, risk, and opportunity. You’ll practice turning raw analysis into narratives that influence what gets built next. Best suited for PMs who already work with data but want to communicate insights more effectively and ensure analytics drives action rather than observation.
Instructors
Related Courses
These recommendations prioritize the same primary tag first, then broader tag overlap, then shared category context.
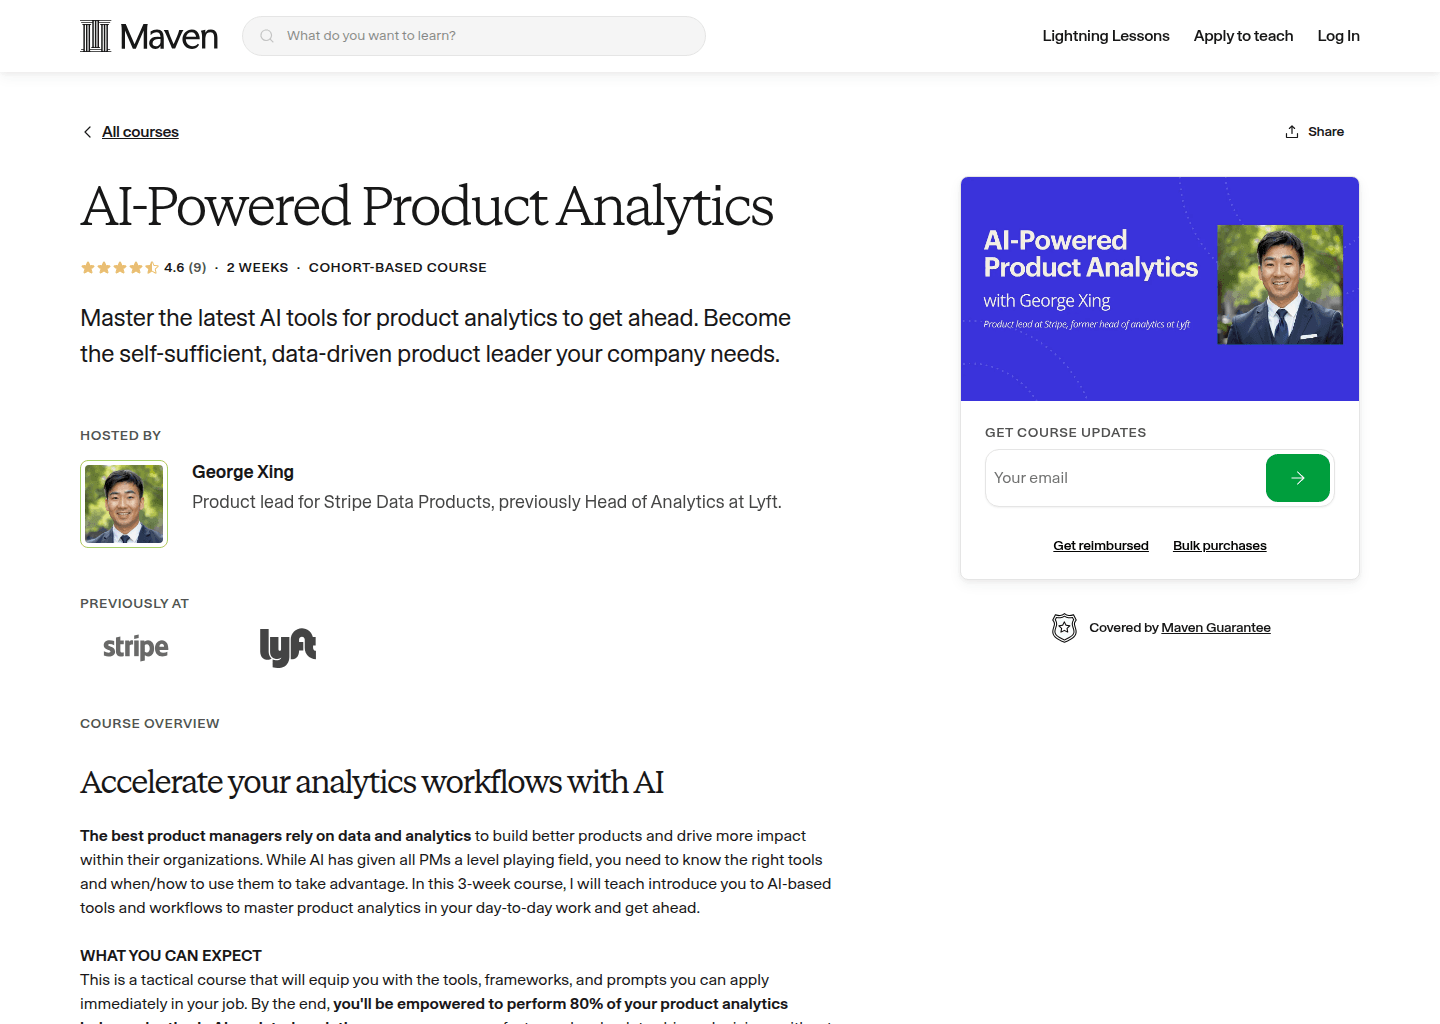
Analytics for Product Managers
Master analytics to make data-driven decisions
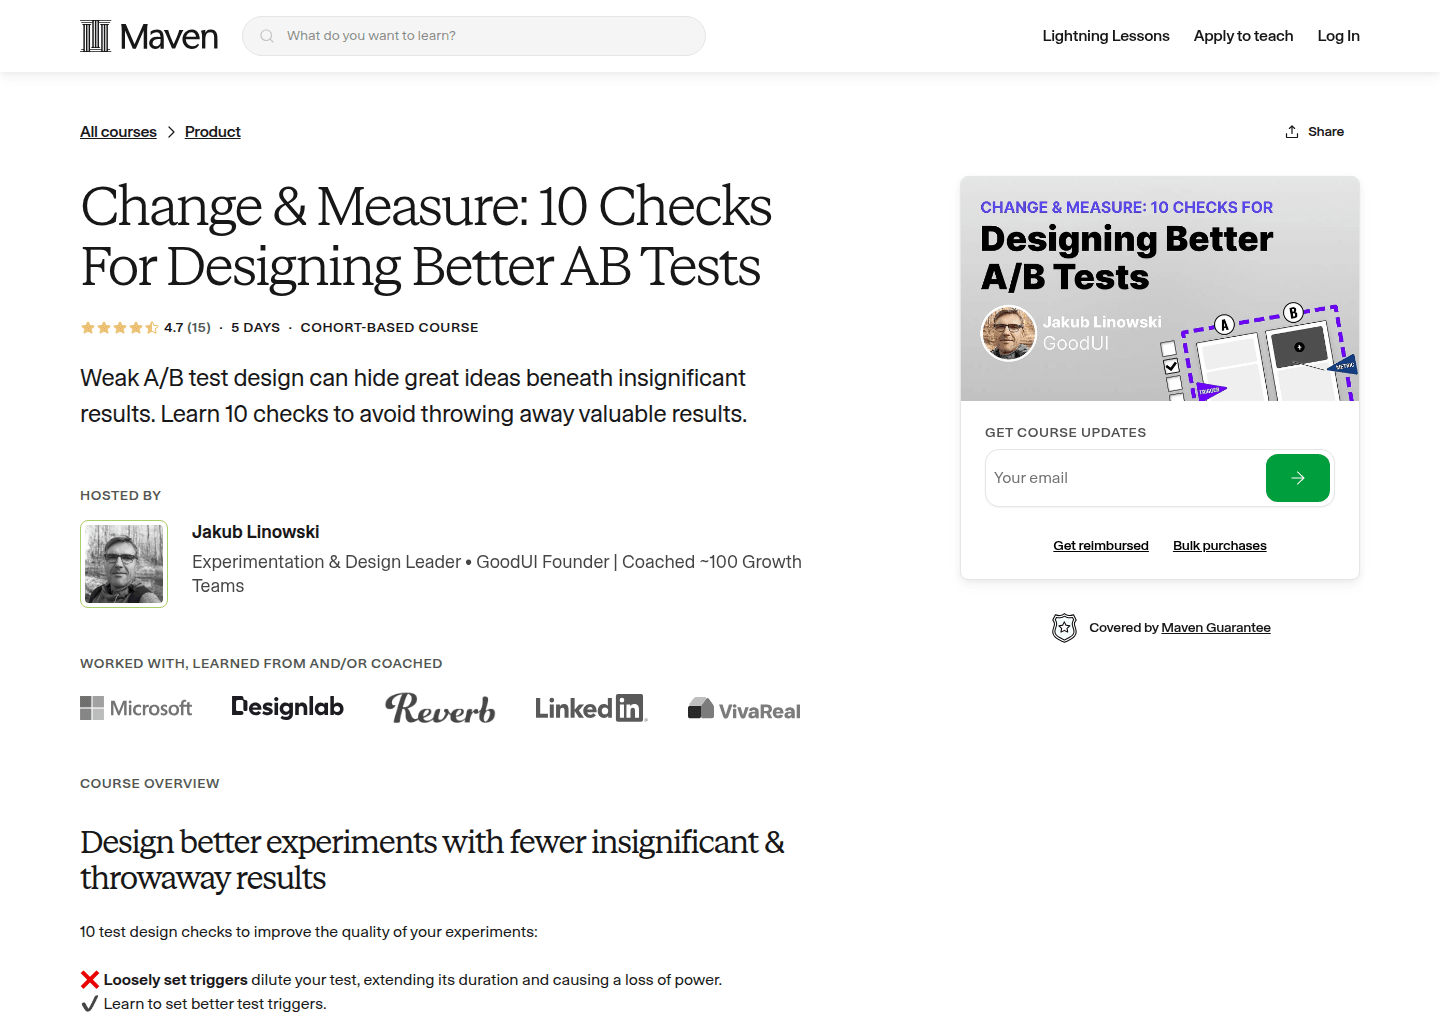
Before You Launch Your AB Test
Design better A/B tests to minimize insignificant results
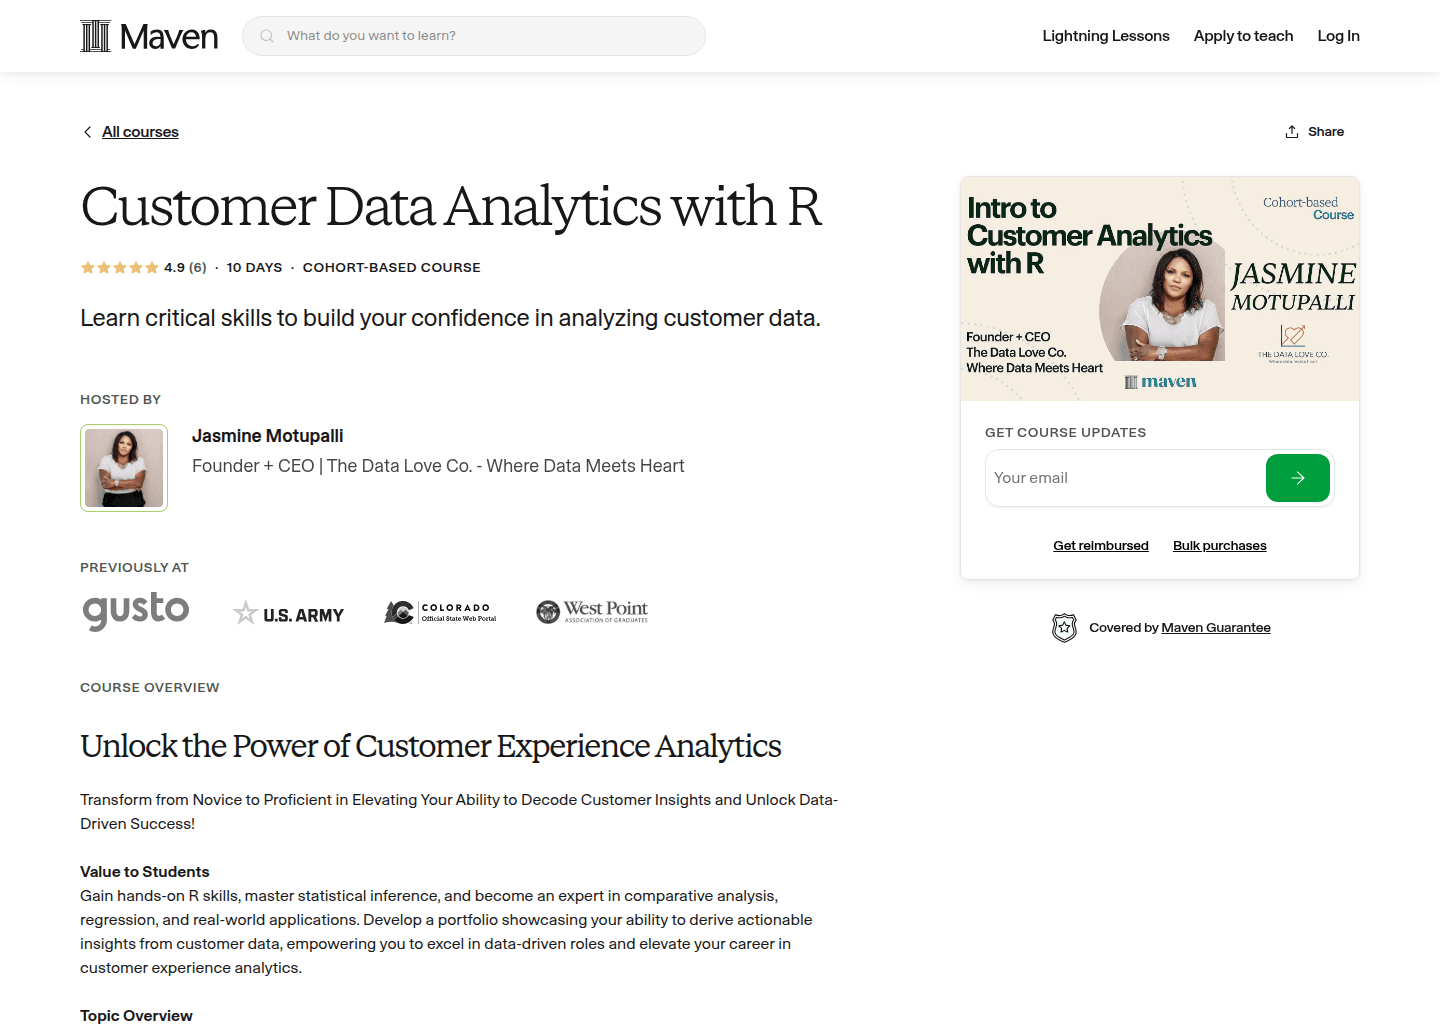
Customer Data Analytics with R
Learn critical skills to analyze customer data and derive actionable product insights
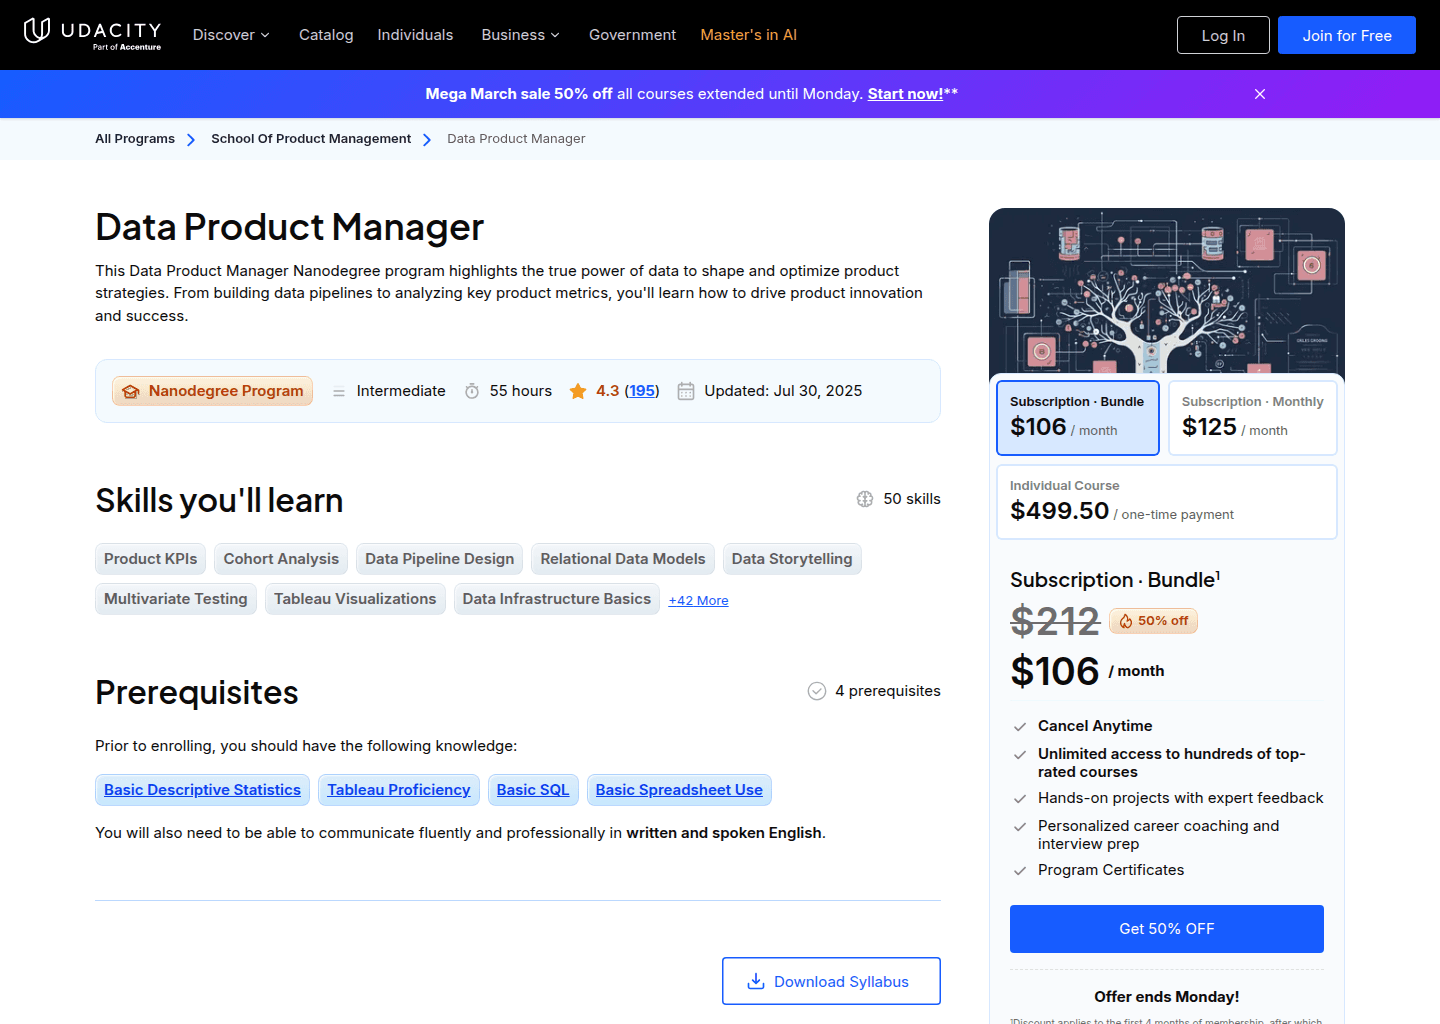
Data Product Manager Nanodegree Program
Gain expertise in data-driven product management
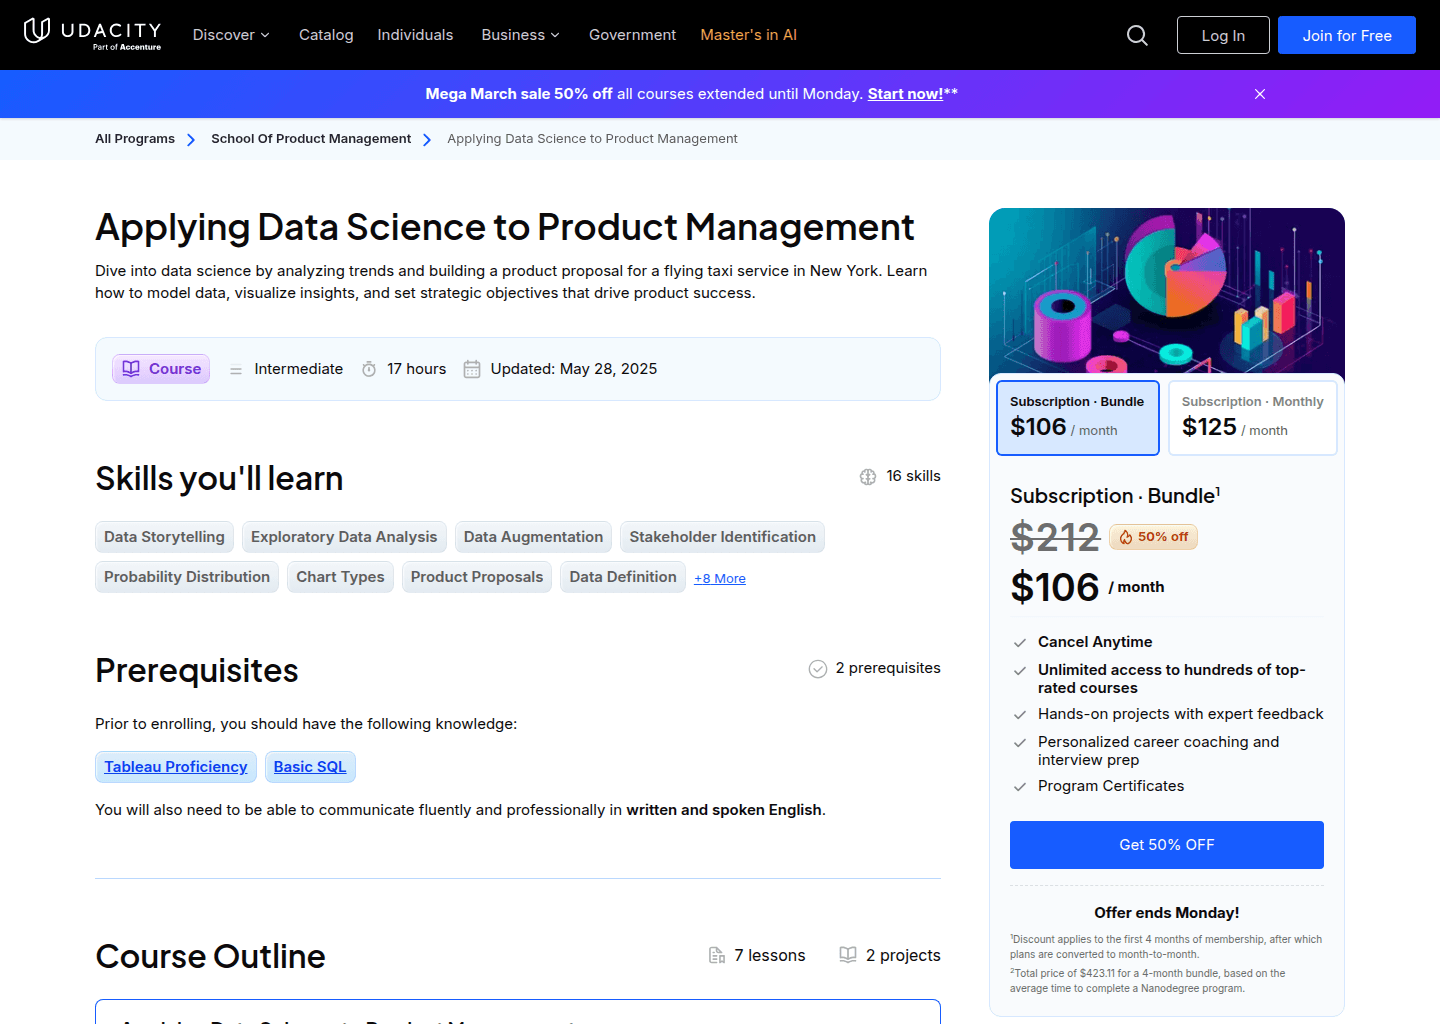
Data Science for PM
Apply data analysis skills to create compelling product proposals through real-world cases
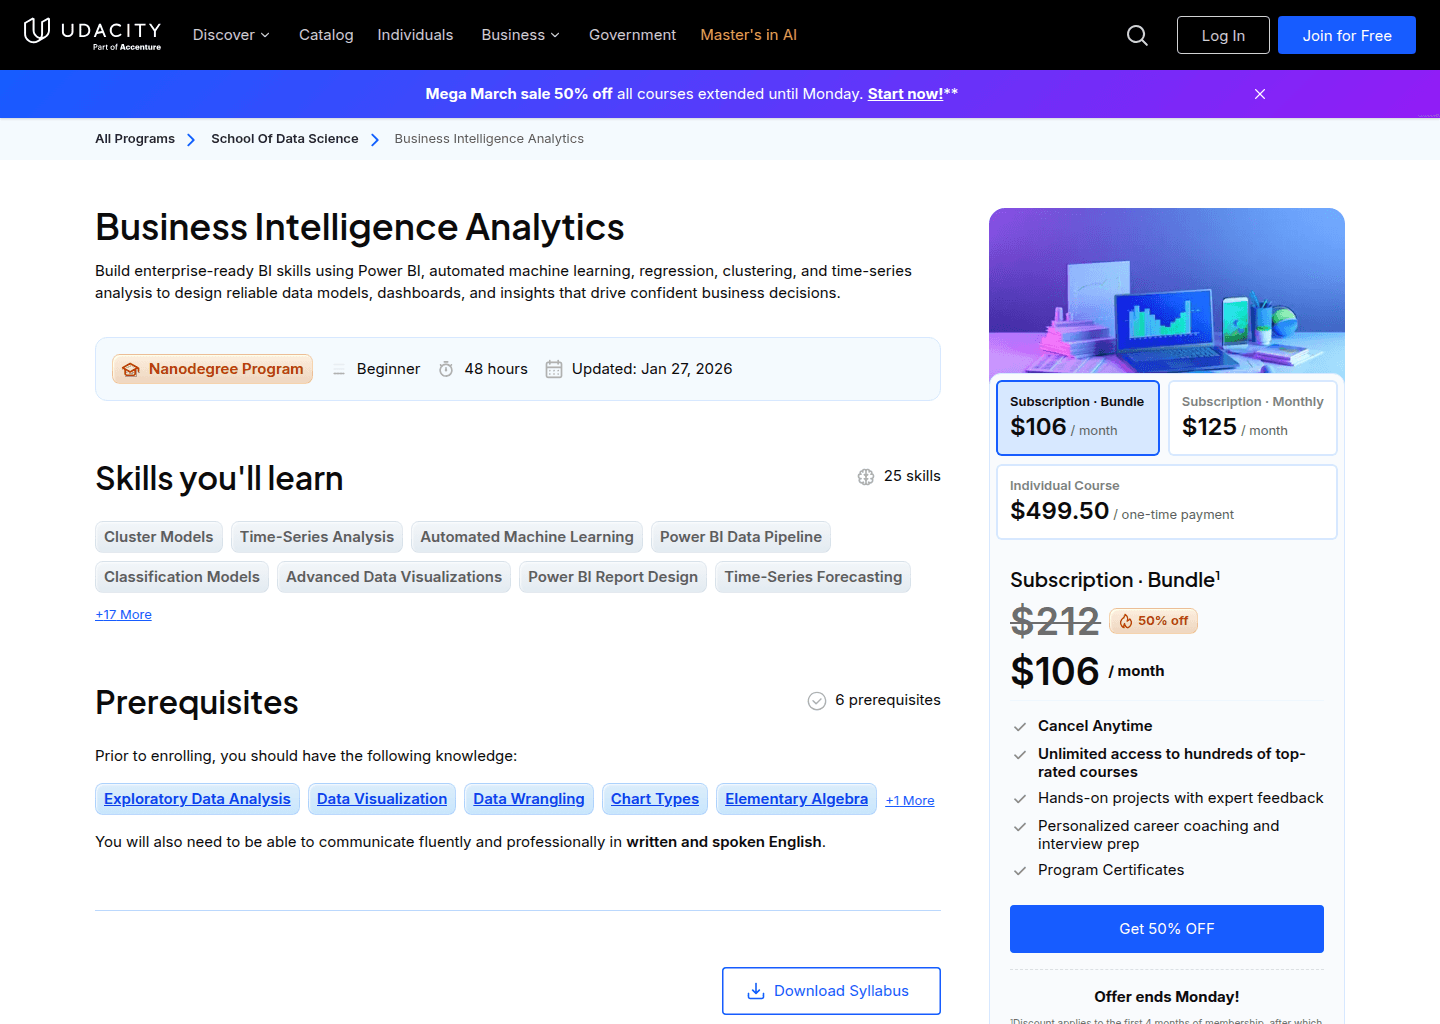
Business Intelligence Analytics Nanodegree
Master business intelligence analytics with Power BI